A Little Help?
A week from today, I’ll be winging my way to CE Week in New York City. I was initially invited by the organizers of the event to participate on a panel titled, “Producing the Very Best Audio” with my friend David Chesky, which is happening on June 23 at the Metropolitan Pavilion at 11:30 am. But as conversations got off the ground, it was decided that I should also host a demo session in the afternoon in the Gallery space downstairs and continue the demos on Wednesday and Thursday. What good is it to talk about high-end audio and the future of high-resolution audio without being able to experience the real deal? Sounded like a great idea to the organizers. They couldn’t think of anyone more qualified to present demo sessions about real high-resolution audio than yours truly.
The afternoon sessions will begin at 1 pm and continue through the close of the show at 5 pm. I will be alternating session with Joe Kane & Bob Kisor who will be discussing and demonstrating – “The Next Great Thing” in television technology, high dynamic range monitors. My presentation is called, “High-Resolution Audio: Formats, Facts & Falsehoods”. However, it meant securing a high-end, 5.1 surround playback system…and some sponsorship. I’m very pleased that Lenbrook was able to come on board with top of the line NAD electronics (M17 Preamp Processor and M27 Power) and PSD (T3 Towers) speakers. My friends at Dolby are also helping out and DH Labs is once again providing their interconnects and speaker cables.
I’ll be there on Monday pulling everything out the boxes, setting it all up, and tweaking things until everything sounds great. In addition to the Tuesday afternoon sessions, I’ll be giving demos all day Wednesday and Thursday in rotation with Robert Zohn, who will doing his TV Shootout. Anyone in the New York area should make arrangements with Scott Wilkinson of AVS Forum to get credentials for Thursday when the program will be open to non-industry participants.
This will be great opportunity to spread the word about high-resolution audio…the real deal. So I’ve been very busy developing a 4-page, full color information piece called, “High-Resolution Audio: A Consumer Guide”. If I’m lucky the printer will get the files late tomorrow and deliver them back before I leave for New York. I’ve been very fortunate to secure a generous sponsor so that we can print and distribute at least 10,000 copies of the guide. It will go to consumers, retailers, equipment manufacturers, and content providers, anyone with a stake in HRA.
I’ve been working all weekend on a double spread infographic showing the differences between “high-resolution audio” production, “standard resolution” audio, and “master source quality”. I’ve finished the first draft and would love to get some feedback from readers. If a few of you would be so kind as to review it and provide suggestions or report problems (spelling, grammar etc), I would really appreciate it. I’m feeling pretty good about the overall presentation. It’s been a while since I laid out a big project like this.
Take a look:
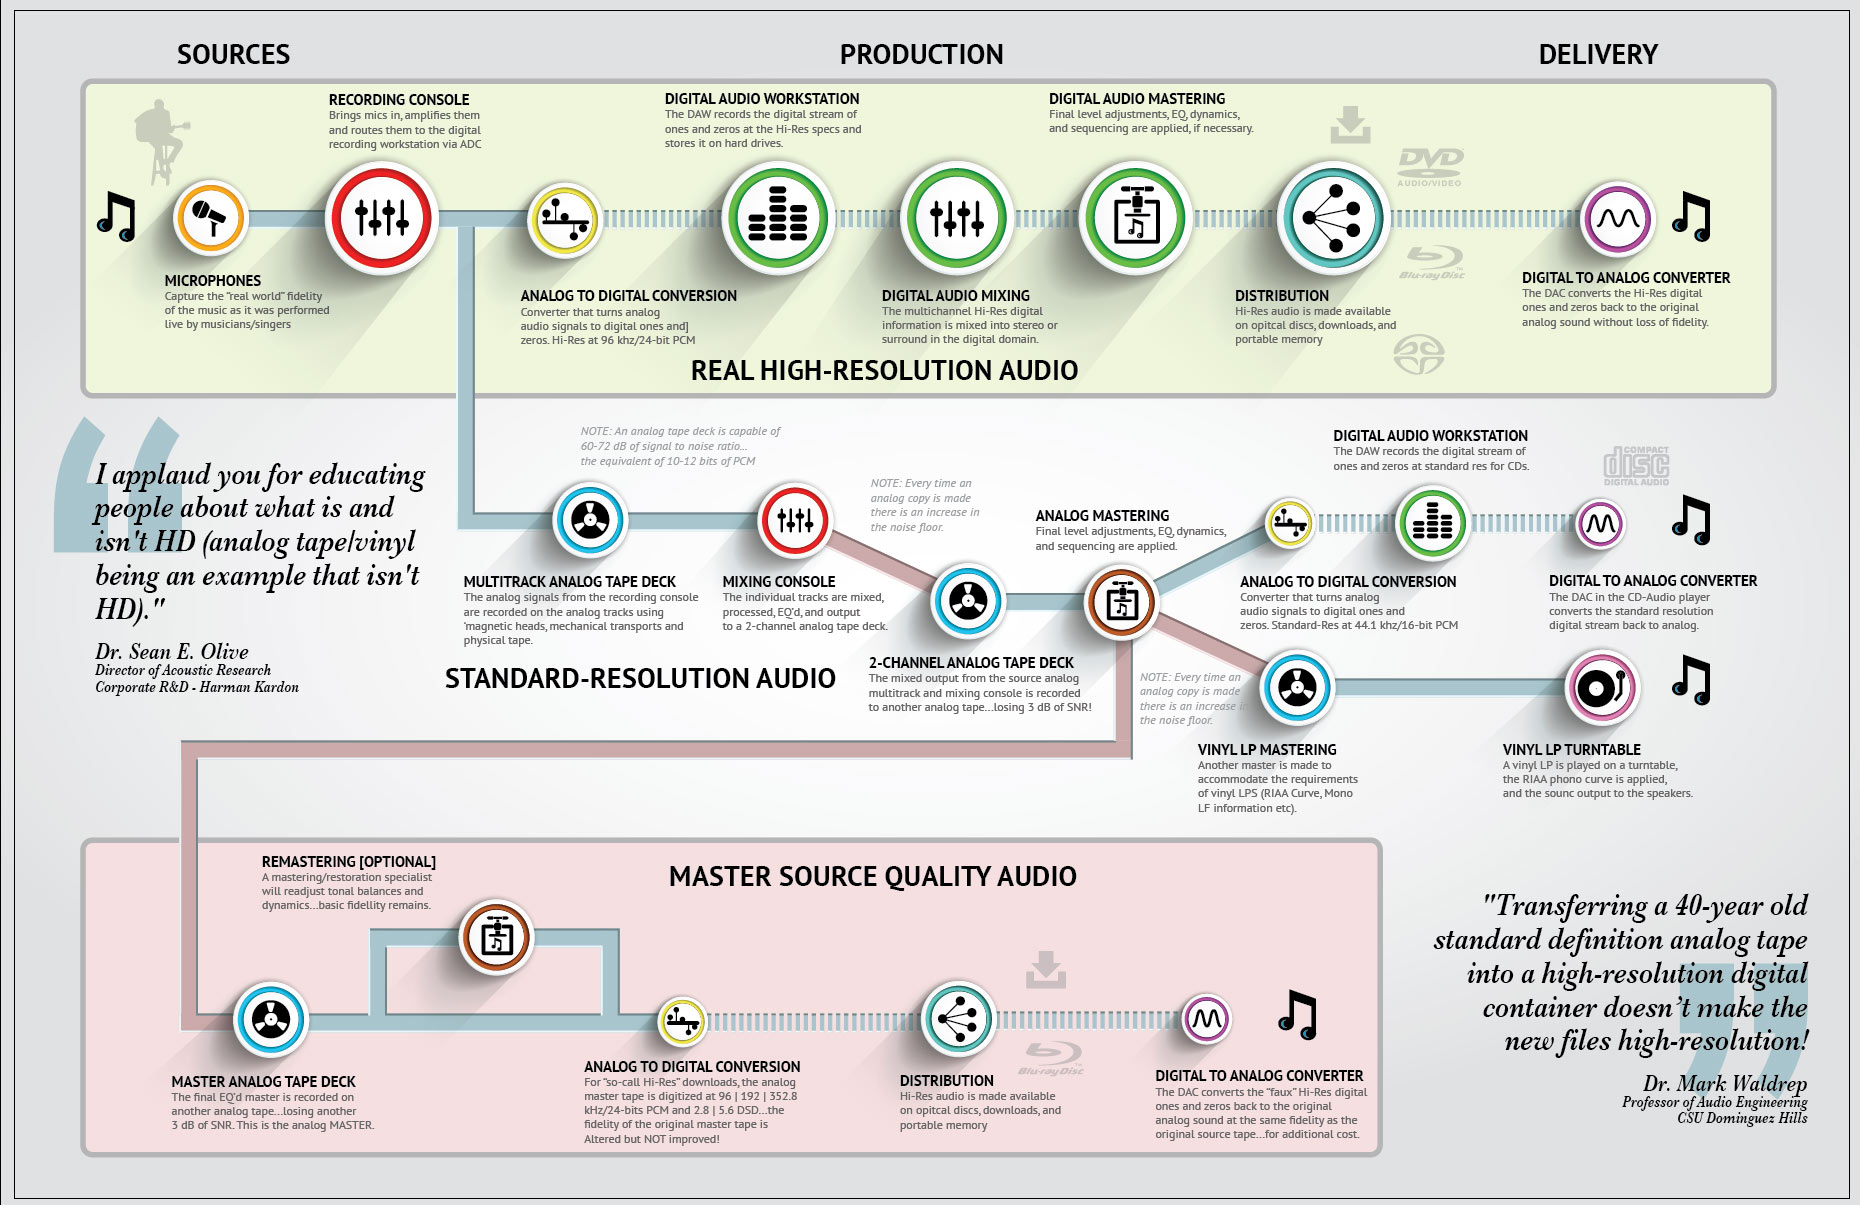
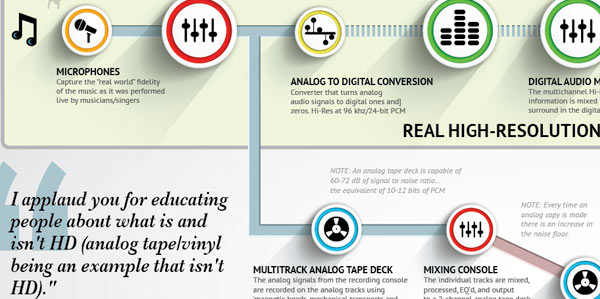
Figure 1 – An infographic detailing the production sequence of high-resolution, standard res, and “master source quality” audio. [Click to enlarge]
I didn’t include DSD but plan to explain it in another section of the document. Thanks for your help. And if you’re near NYC on the 25th, please come by the Altman Building.
A very informative info-graphic, well done! My only question is, when you refer to “Master Source Quality Audio” at the bottom of the graphic, are you specifically meaning Meridian’s new program or any Hi-Res remastering scheme? This would include HDTracks, Pono, et all.
Best…..Carlo.
Here are some spelling errors that I found:
Distribution – opitcal
Vinyl LP Turntable – sounc
Remastering – fidellity
Wow!
I am not an expert on the subject but this is very well laid out and easy to follow (always a good sign when a novice like me can understand a diagram of something I am only starting to comprehend).
I can’t wait to hear about the outcome of this presentation.
Good luck in the big Apple.
Regards
JC
Mark,
Hi. I have enjoyed your e-mails for quite some time. Thanks for all of your efforts.
I have a few suggestions for your infographic:
1. You mostly put periods at the end of your sentences/phrases but some are missing
2. I would make the box around the real high res audio area more distinct to differentiate it more
3. I would make the other 2 areas the same colour and align the standard resolution audio title with the others
4. I would emphasize that 96khz/24 bit means a max. frequency range of 48khz and 144 db of dynamic range (or whatever the amount is)
5. I would explain in a quick note what dynamic range means
6. I would put another quick note of the limitations of frequency range and dynamics for analog tape
I live in Calgary AB Canada, so I don’t really have the opportunity to see you at a show. I wish I could some day. I do love many of the DVD-AUDIO disks you have produced, and have one of your blu-rays as well.
Keep up the good fight.
A to D conversion. Typo after the word and, “ones and] zeros”
MSQA A to D conversion. “so call Hi-Rez” should be “so called Hi-Rez” ?
Distribution. “Hi-Rez audio is made available” I’d call it “Master Quality Audio is made available”
That’s all I see, Looks real good.
Could you make available a pdf copy of the “High-Resolution Audio: A Consumer Guide” on your download site when time allows?
Hi Mark
Small typo under Vinyl Lp Turntable, to whit “sounc”
Nice graphic, good luck at the show
Brian
Morning Mark,
I understand what you are trying to communicate with this infographic, regarding the provenience of the tracks being offered to the market. However 2 comments:
1. You have already included support for DSD with the SACD symbol in the ‘Real High-Resolution’ box, given that a SACD is the physical distribution format for DSD64.
2. Are all Vinyl pressings originated from Analog Tape based Masters – yes there is Analog conversion at the final stage prior to the cutting head, but the source material is not restricted to Analog Tape, so you need to adjust this.
Isn’t the purpose of your message to highlight the continued resale of existing material, recorded on Analog Tape and less than 24/48, then repackaged into bigger bit buckets and offered as Hi-Res.
This is very similar to the behaviour of the Record Labels, in the late 80’s with the initial introduction of CD, they reissued their entire back catalogue on CD without any thought or attention to the mastering for this format, just to get sales, resulting in some CDs with dreadful SQ out there.
Good luck at the upcoming show and events.
Simon.
Thanks Simon…all good suggestions. I’m working on rev 2 as we speak.
Very informative infographic. Can’t wait to see next one, about DSD. Now, me thinking about some (a lot) HRA files “high quality”. My question is. That’s how things work for every body in the business or it is how it should work, minimum?
You’re right I really need to break down the DSD production path as well…this takes a very long time to pull together. Stay tuned.
Brilliant, clear and concise diagram of the production audio workflow. Well done!
Hi Mark,
Should be ‘Mixing Console’ not ‘Recording…’ on top row,
a ‘]’ has crept in under ADC ones and zeroes,
will everyone know that ‘ is short for ferro when using magnetic heads?
Vinyl LPs not LPS,
‘….is applied, amplified and sent to speakers’
There are two ‘NOTE: Every time…noise floor’
Apologies for terseness, but my typing speed is super slow!
Looks like there’s a market for digital microphones, or do you use them already?
Great work!
There are digital microphones and digital speakers…I don’t use them and they are probably outside of this round on the illustration.
Overall, a VERY nice looking and informative chart. One of the best I’ve seen in a long time!
However, there are some wording/typo/etc. issues that would take too long to type in this field. If you want to discuss them, feel free to contact me via email.
Thanks!
I will see you Thursday. Looking forward to it, the Joe Kane presentation and the flat panel shootout.
Looks good to me. While I believe many of your readers know and understand the above info. I believe there are many out there who have no clue of the path a recording takes, to end up in their music collection.
This should be posted far and wide.
Mark,
In the upper box called “Real High Resolution Audio”. I suggest that the input to this box be the output from the actual microphones rather than going thru what appears to be an analog mixing console
Thanks Robert…the thinking here is that microphones are analog and they require mic preamps, which are also analog…that’s what’s happening in the recording console.
Thanks for the opportunity to be a reviewer and help out. Your blogs have certainly helped me out in the past.
At the Analog to Digital Conversion step in the Master Quality Audio box, change so-call to so-called.
The Dr. Olive quote needs an opening quotation mark.
The Dr. Waldrep quote needs a closing quotation mark.
Standard abbreviation for kilohertz is kHz with H capitalized (see the Analog to Digital Conversion step in the Real High-Resolution Audio box).
One question about the Analog to Digital Conversion step in the Real High-Resolution Audio box. Should its description also include 192 kHz and maybe 88 kHz and 358.2 kHz too, or are these hi-res format frequencies created in another step?
At the Multitrack Analog Tape Deck step, there appears to be an open single quote at magnetic, but not a closing single quote (or am I just seeing spots!).
Phil C
I really like the chart from a content perspective, but I have trouble with the purely graphic aspect of viewing a chart, as it doesn’t allow me to compare analogous aspects at a glance, and it forces me to get very up close to read the rather small texts, loosing the overview. In my humble opinion, the chart should clearly set the graphic relationships I’m looking at, and not force me to find or decipher them going back and forth.
If I could make a couple of suggestions, it would be to separate the three sections (Real High Resolution Audio, Standard Resolution audio and Master Standard Quality Audio) in three equally large and parallel single colored fields, which allow direct comparisons when possible (with the color coded icons), and that provide a visually accessible and intuitively logic comparison chart. I would use a black background or frame, and perhaps a column with the meaning of all the icons to the left, or listed below the graph like you find icons in maps.
I would also not use the two quotes that you have added, as they tend to deviate the attention from the logic of the argument that I feel the chart should provide from an as purely graphic perspective as possible. I would also chose stronger colors and try to reduce elements that tend to lessen the consistency of the graphic comparison element.
On the content side, I would also include a breakdown of a DSD source/production/delivery sequence, and perhaps also add the new MQA format as part of a delivery variant, to make clear that it is only part of the delivery, and thus has no relevance for provenance.
Also if you think it in a poster format – which would actually be a really cool chart to print in poster format – you could add more rows downwards. The ascending order also makes a graphic point as to the quality aspect of fidelity.
The concept of provenance is pretty much absent in name, and I believe it should be more present, as it is the most relevant element when it comes to specify quality in relationship to the final delivery format: no HRA provenance = no HRA delivery possible despite 24Bit – 48/88/96/174.4/192kHz digital specs of audio files.
Your definition of HRA, as well as the necessary elements that are requisite for audio recordings to meet HRA standards (frequency response, dynamic range, etc) should also be introduced, as they represent the meta criteria to which the qualitative differences ultimately respond.
The science based content that the graph is based on, necessarily establishes the parameters by which we can articulate the concept of HRA, and the argument of the chart is the distinction of final audio products depending on the production chain and ultimately, on provenance, that is, if the conditions of the actual recording session meet the requirements that could potentially qualify the final result as HRA.
Keep up the excellent work!
Cheers
Thanks, I’m working on rev 2 right now. Good suggestions.
Mark,
An excellent chart, so well done. My only comment, which may be a case of semantics, is that in the Rea High-Resolution Audio section it ends with “….without loss of fidelity”
I am not a scientist but something will get lost when going from analogue to digital, we just may not hear it, Unless we think ‘Fidelity’ is a subjective term.
Again, a great discussion illustration, which I will use.
There is nothing lost between the input analog signal and the output analog signal.
Sorry your graphic is false. There are thousands of CDs being created without any analog tape and or mastering.
I have read hundreds of your articles and you gave an impression that you stand for the truth but now your true colors are showing. Please change your graphic or it’s probably time for me to stop reading your posts.
Andrew, the infographic is not meant to be exhaustive and show every production path. The standard-res production path is typically what happened before DAWs. I’ve added a couple of additional lines. I’d be curious to know how this limited graphic shows my “true colors”? I would push back on the notion that thousands of CDs are being created without being mastered…every disc has to go through at least minimal mastering for sequencing, PQ codes etc.