How To Read A Spectragram: Part I
The new iTrax.com website is coming along and I’m designing each product page to have a tab that will display a spectragram from a track or two taken from the album. I use the Adobe Audition application to analyze tracks of my own and those from other labels and download sites to determine the “reality” of their high-resolution claims. You can tell a great deal about the production process by examining the spectragrams…if you know what to look for. So by popular demand, I’m going to dedicate a few days of posts explaining in detail how I produce a spectragram, what information is included and how to interpret them. I know I should have done this a long time ago but better late than never.
A spectragram is a visual representation of a sound presented over time that also indicates the amplitude across a range of frequencies. The device or software that generates a spectragram is a called a spectragraph (it seems I should more correctly be calling the plots that I generate and display on this site spectragrams NOT spectragraphs). While spectragrams are used in the fields of sonar, radar, speech processing and seismology, I’ll be limiting my discussion to their use in high-end audio and music.
Let’s take a look a blank spectragram as produced by Adobe’s Soundbooth application (a previous version of their current application – I use this one here because it can scale on the frequency axis).
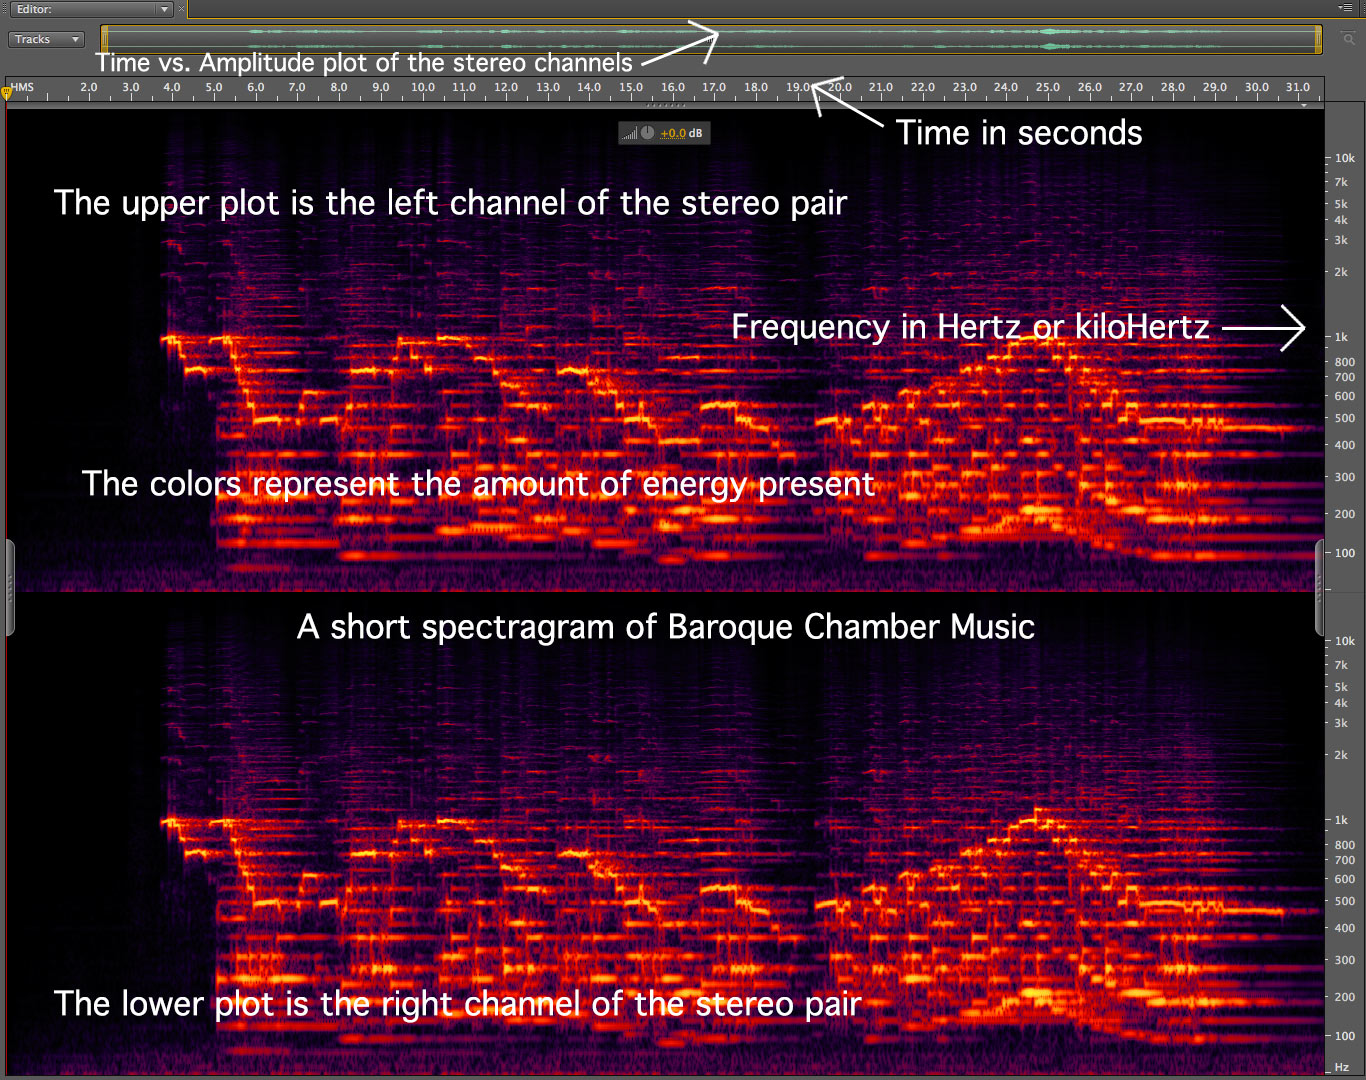
Figure 1 – An annotated spectragram generated by Adobe Soundbooth [click to enlarge].
Here are some things to notice about this graphic. The brightest yellow/orange lines are the main notes of the melody and chords that comprise this selection (I scaled it very large to show the detailed information that can be seen in the music). As the colors move towards red and purple, you are seeing the “partials” or “overtones” that are generated with every musical tone according the natural overtone series (which just happen to be integer multiples of the fundamental…pretty cool!). These components contribute to the brightness or clarity of the high end of the frequency spectrum. If they’re not there, things start sound dull and covered.
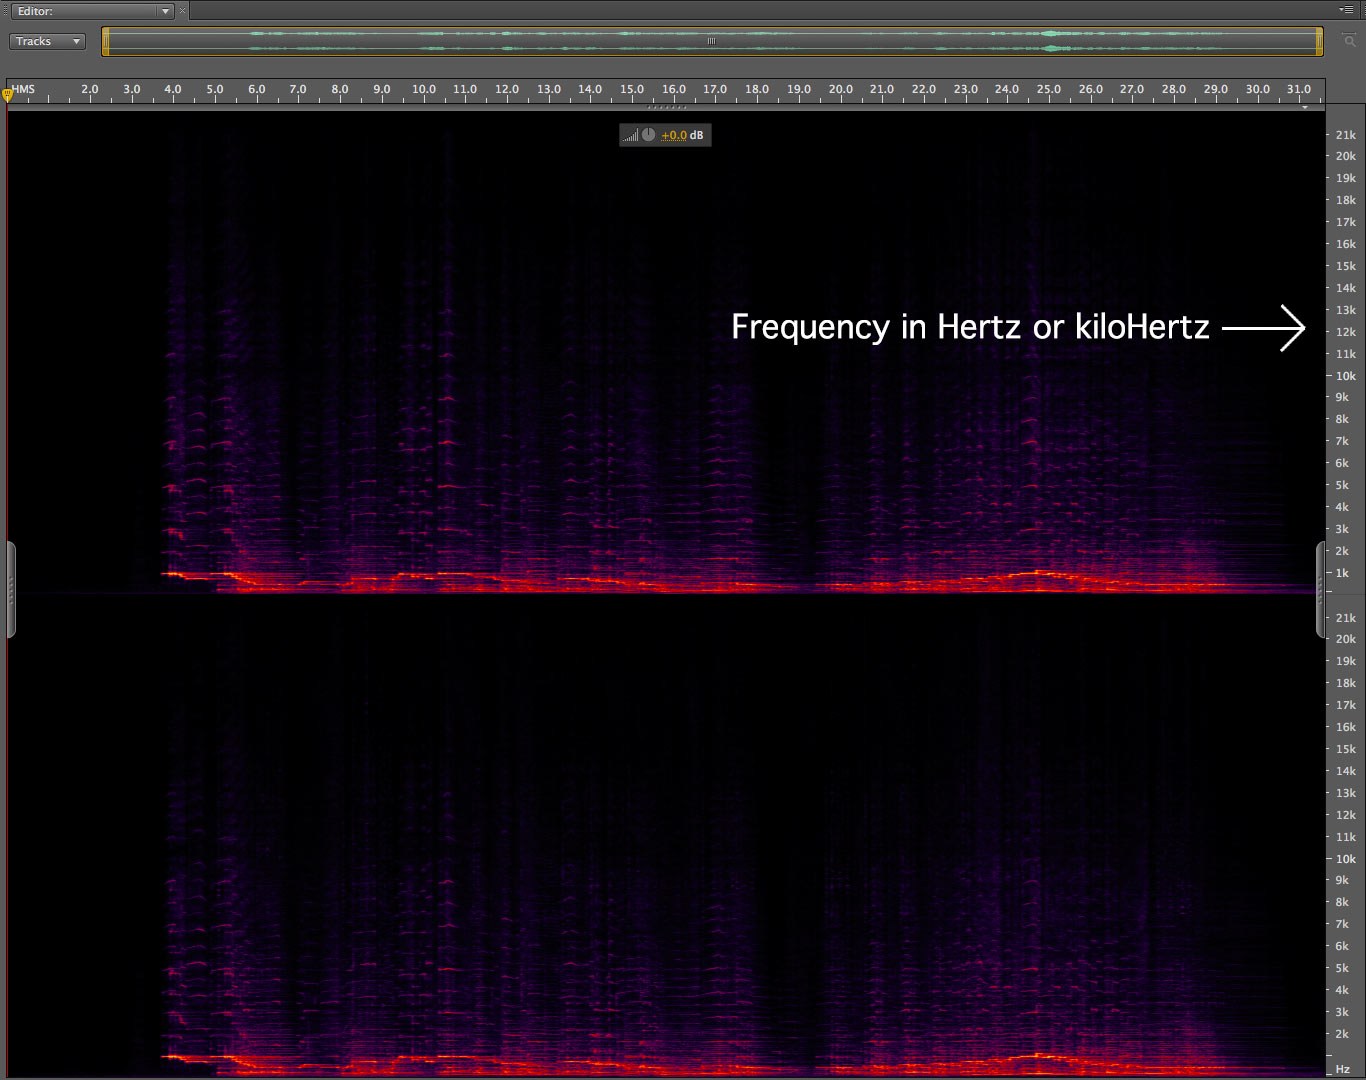
Figure 2 – Here’s the same selection with the scaling at its maximum [click to enlarge].
Looks dramatically different, right? The details of the musical information a squeezed into the bottom portion of the plot but the frequency range on the right has opened up to reveal the sampling rate of the source digital file. In this case, the sample rate is 44.1 kHz because the highest frequency on the frequency axis is 22 kHz or half the sampling rate of a CD.
What are also revealed about this particular selection of music are the highest frequencies that are present. Remember that the purple wisps are the very upper partials of the music. If you look carefully, you can see them extending to about 16-17 kHz at about 11 seconds. Not bad. But well within the capabilities of a compact disc.
So let’s leave it at that for today. I’ve got to get back to some grading and (I gave midterms last week and the students would love to get the results of all of their studying).
I’d like to recommend Spek as it’s free and works across platforms.
http://spek.cc/
You can adjust the frequency height and it has more colors and a helpful legend on the side. You can make the images as big as your screen and save them.
You maybe should have mentioned that the main reason for the visible difference between the diagrams is the change between log and linear scale on the frequency axis, and that on the log scale, all multiples are associated with a fixed “distance” in y direction (… cool, too 🙂
Slim, the scaling feature is actually happening in Soundbooth and does move between linear and log displays.
Pingback: First Experiences: Part II | Real HD-Audio