How to Read a Spectragram: Part IV
Here’s the quick summary on the previous installments on “How to Read a Spectragram”. We’ve looked the basic layout of a spectragram and the various axes that flank the plots that are commonly output. I analyzed a standard definition CD file AND a real HD-Audio or high-resolution file and pointed out the differences that higher sample rates can make. And finally, I put a spectragram of a high-resolution 96 kHz/24-bit PCM digital file vs. the same piece of music recorded using a professional analog reel-to-reel machine. We notice things like the bias frequency and the increase in high frequency hiss in the analog tape version.
Today, I would like to explore a problematic spectragram. What can we determine about the production process of a project from a spectragram…especially when the producer/label is using technology that has some problems in it.
Below you will find a rather problematic spectragram represented in two different plots. The first one is laid out like the ones that we’ve been looking at over the last few days. What’s immediately noticeable in this recording is the large amount of ultrasonic noise present above 40 kHz. I understand the argument that our equipment…the processors, amplifiers and speakers…can’t do anything with the stuff way out of the range of human hearing, so we shouldn’t worry about it. I’m sorry but I do. There’s something intellectually wrong with a recording that can’t represent the “blackness of space” accurately. Here’s Figure 1 of a recording made using DSD 1-bit technology at 5.6 MHz.
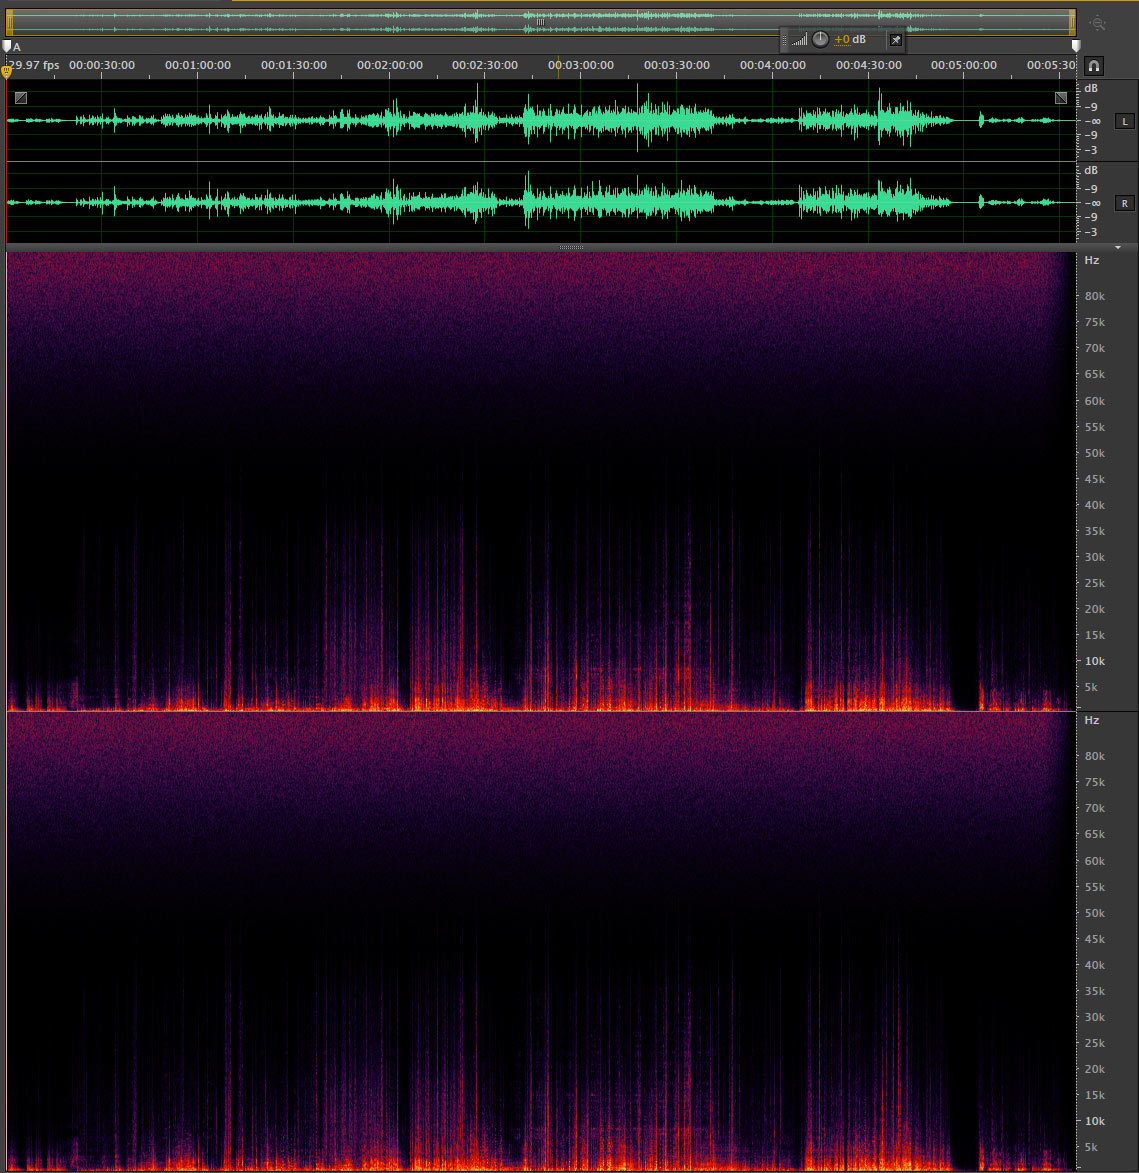
Figure 1 – The spectragram of a DSD 5.6 MHz recording showing the ultrasonic frequencies [click to enlarge].
If the recording had been done at standard DSD 64 (which represents the majority of the SACD and DSD files produced thus far, the ultrasonic frequencies would show up at around 22 kHz. There is no need to even think about high frequencies or ultrasonics if there’s nothing but noise about 20 kHz. It should be apparent that HD PCM does a MUCH better job at accurately capturing and reproducing high frequencies. However, it might just be the inaccuracies that make some people fans of DSD. Go figure.
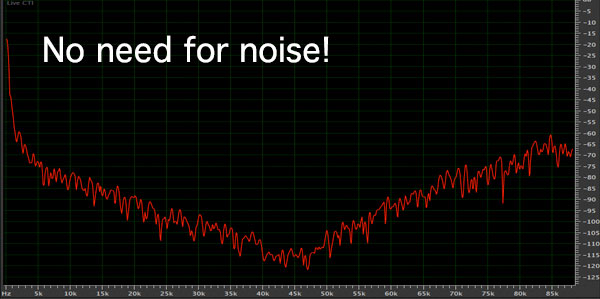
Another way to plot the spectra of a sound file is to show the frequencies along the x-axis and the amplitude on the y-axis. We’ve dropped the time component. In order to create this plot you simply identify a start time and an end time and calculate the average amount of energy available across the frequency spectrum. Here’s the entire piece of music using this second method.
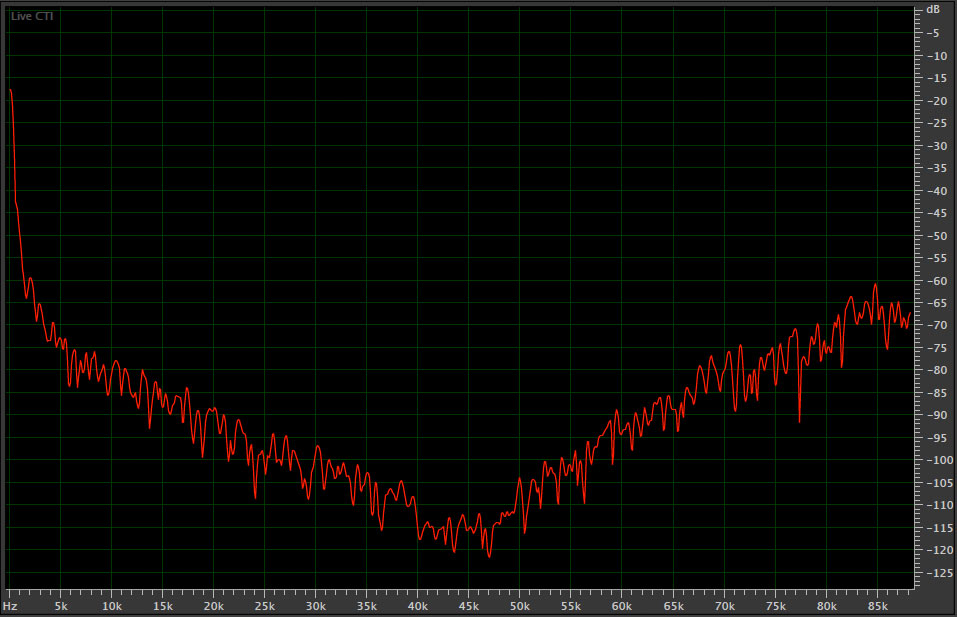
Figure 2 – A spectragram plot showing the rising noise of a DSD format file. Normal audio energy never gets louder as you move up in frequency [click to enlarge].
There are other ways that create problematic spectragrams. It might be a few days until I can continue on this thread. I’m leaving for the TAVES in Toronto in couple of hours and will be reporting on the show.
I have been enjoying your Spectragram series and have a question for you. One contention of analog enthusiasts is that analog recordings capture more overtone information, which contributes to a sense of normal instrument timbre. It occurred to me that the spectragrams were a good method to evaluate that claim since you can alalyze the amount of energy versus frequency in a recording. For example, in a piano recording, C8 has a frequency of 4186 Hz, so any energy above that should represent overtone energy. How do the different formats compare in this basis?