Charting High-Resolution… For Real
Yesterday’s post about a couple of published charts prompted a few comments and a couple of private emails of concern about my recasting of the “resolution bars” from the HTR chart. Many of you have seen the spectrograms that I’ve posted on this site and understand a few basic things about formats and fidelity expectations. I thought I would provide a brief refresher for those seeking to understand the differences between the actual specifications, the potential fidelity of a particular specification and a simple bar chart like those so commonly put on the web as “infographics”.
Bar charts try to use the numbers associated with a format to impress. The bigger the numbers the better, right? I read yesterday about the new Nagra DAC that was introduced at this week’s Munich Audio Show. They and several other DAC makers are pushing 384 kHz as a reasonable sample rate for converting audio to PCM and back (Exasound, I think was the first company to move into the upper stratosphere of 384 kHz…of was it Light Harmonic). There is absolutely not reason to use 384 kHz as a sampling rate…I’m content with 96 kHz.
“Potential” fidelity is a concept that is actually quite complex. We’ve talked about the fidelity of the formats, the fidelity of the original mixes and the fidelity of the final mastered music. And don’t forget about the fidelity of the hardware, cables, speakers etc. But if we strip things down to the simplest and primary components of audio fidelity it comes down to dynamic range and frequency response. I think of this potential fidelity as a two-dimensional box with frequency response along the x-axis and the dynamic range along the y-axis.
Take a look at the figure below. This is the basic graphic used by Adobe’s Audition program.
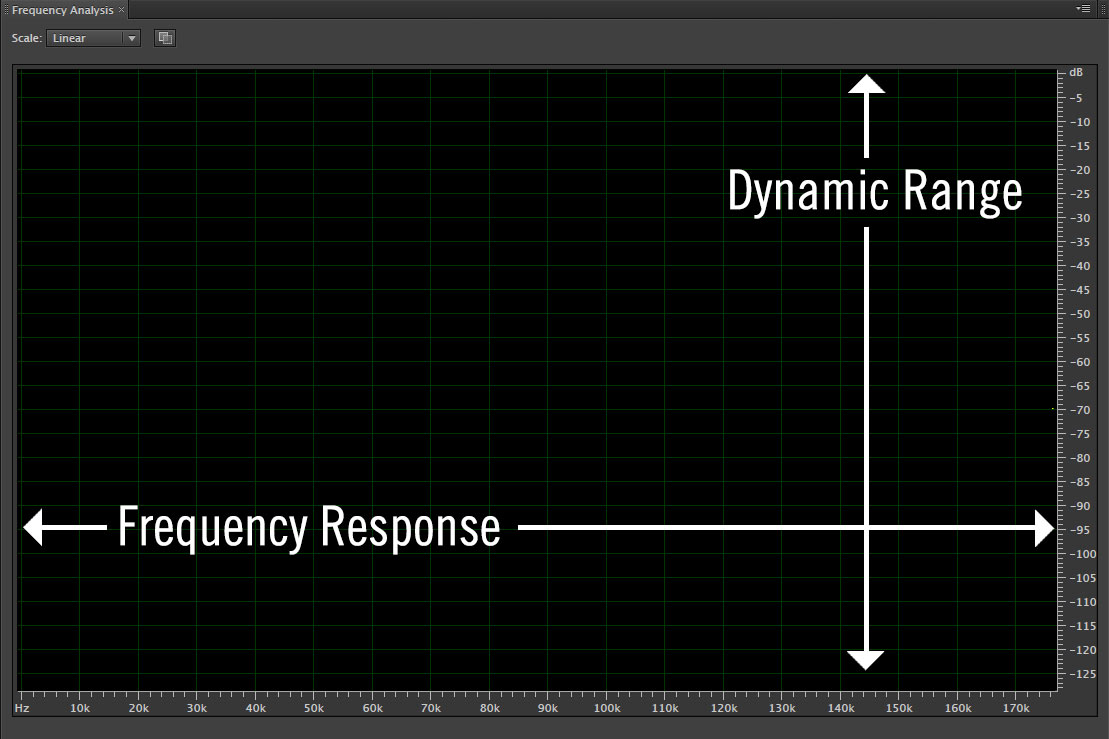
Figure 1 – The graphics used by Adobe Audition to view frequency vs. dynamic range. [Click to enlarge]
So each of the bars in yesterday’s HTR charts consisted of an encoding type AND some typical parameters associated with those formats. There were MP3 files, LPCM (usually just called PCM) and DSD AND they ranged from 64 kbps, to 1411 kbps (for CDs) to around 4000 kbps for 96/24 and so on. The person behind the chart then slipped into associated relative “qualitative” measures to these numbers. This is where the provenance of the tracks matters. If an analog tape from 1958 is transferred to a DSD 64 file…it can’t possibly measure up to a new recording at DSD 64 or better yet, a 192 kHz/24-bit PCM track.
So I took some time this morning to recast the “relative resolution” bars of the HTR chart to “potential fidelity boxes” on the Audition grid. Take a look at Figure 2 below:
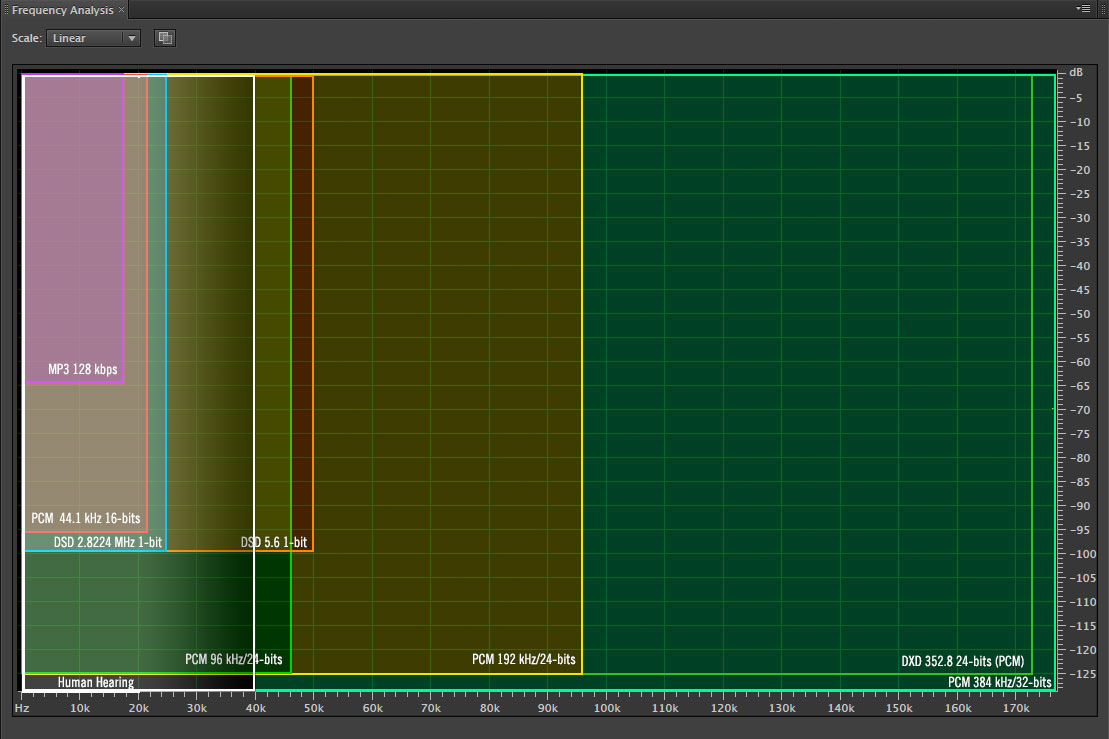
Figure 2 – The “potential fidelity” of various audio formats and specification levels. [Click to enlarge]
I believe this is a more accurate representation of the information about formats. It certainly works a lot better than simply multiplying the numbers and ranking things based of magnitude. The article on the new Nagra fell into that trap by saying the DSD 128 capability of the new unit is “256 times better than a CD”, which casual audiophiles might believe unless they know that how much real world frequency dynamic range is associated with DSD 128 (I’m not even going to start talking about the fact that virtually no one is making native recordings at that rate.
And please don’t forget to notice the “white” stroked area that represents what human hearing can handle. I put a gradient past 20 kHz to around 40 kHz…and I get plenty of push back on that. So why are we talking about formats that give us 196 kHz?
Think of each of the boxes in the diagram as the area in which sound can exist within each of the formats. Of course, finding recordings that fill up the potential space is near impossible…and perhaps it doesn’t matter.
Linn has been upsampling to 352.8kHz or 384kHz in their DS players since 2008…guess the others are catching up!
http://docs.linn.co.uk/wiki/index.php/Up-sampling
Thanks Chris…upsampling, there’s another topic to talk about. You don’t get any additional fidelity by upsampling.
So why do they do it?
They do it because they can talk about higher numbers and sell more units.
This is a great picture that is better that a 1000 words. Could you please add a couple of layers : analog vinyl and reel to reel tape, please ?
I’m reworking the chart based on some of the suggestions and some valuable information that was emailed to me. I was stuck with 125 of dynamics based on the size of the basic plot. I’m not expanding the chart to get to 145 dB.
All this 384 kHz SR is crazy talk, if you plan to play the music to humans. I’d love a test where you started with a very hi res recording that the participants agreed upon, played thru a very hi res system that the participants also agreed upon. Then provide buttons that drop in low pass filters in the digital domain. Say, 10 kHz, 15 kHz, 20 kHz, 50 kHz, 100 kHz, etc. The buttons named and arranged randomly, A, B, C etc. I believe many listeners would hear the 10 k filter, some the 15 k filter, and that the listener impressions for filters above 20 k would be randomly distributed.
Mark,
It would be instructive to create notional boxes in boxes for vinyl and analog magnetic tape capabilities vs. the already identified digital formats that you’ve plotted, especially considering the 3-4 dB loss for every derivative copy made to go from original recording tape to the consumer. I assume that bit resolution depth converts to SNR. Most analog recordings were not able to go much beyond 20 KHz, IIRC, and by the time that we actually get an analog recording at the retail level, it has perhaps 12 dB of available dynamic range.
One reason to do this is to graphically show why taking older recordings and converting them to digital formats yields not much more than mp3 levels of dynamic range and FR in two dimensions.
Another idea that comes to mind is to plot the excessive levels of DSD HF noise on the same basic plot to show the amount of energy that has to be filtered out from the audio signal to present to the listener at playback time.
One last idea: showing the actual SNR vs. frequency envelope as output in popular recordings. Each transfer in the audio chain removes perhaps 2-3 dB (see http://dr.loudness-war.info/ and http://www.diyaudio.com/wiki/Loudness_War_Dynamic_Range_Compression_and_The_DR_Database_-_Observations
Analog transfers actually cost about 6 dB.
I am impressed and agree with your chart . I was really shocked to see the ‘ potential fidelity ‘ of the 2.8 and 5.6 Mhz DSD format compared to PCM (WAV/FLAC) since AcousticSounds.com and Sony appear to be pushing that format. I hope we can move on to hardware soon. Especially interested in stand alone HiRes players like the Oppo and Sony’s HAP-Z1ES..
Stay tuned…I’m getting there.
Brilliant post today. Just love that Fig 2. graphic – clear as day…
This “potential fidelity” chart is an improvement, but I have a couple additional suggestions. Why did you limit the 24-bit PCM dynamic range to 125 dB, shouldn’t the 24-bit PCM dynamic range limit be 144 dB? Also, while using a linear scale for frequency is technically accurate, wouldn’t a logarithmic scale be more representative of how we hear (in octaves)?
The raw plot from Adobe is limited to 125 dB. I’m reworking this to account for that shortfall and changing some other thing.
Mark,
I suppose maintaining higher resolution (say 384 kHz) during production makes sense, and then you would employing downsampling to 96 kHz? This idea applied to image processing is quite useful, where say a graphics card processes images at 2X or 4X the monitor resolution in its memory, then downsamples to 1X (1080P). This has a noticeable improvement in the displayed image quality.
I am willing to accept that having a higher frequency container than 96 kHz does not allow for greater audio fidelity; in theory all the audio frequencies we desire can be stored from analog to digital conversion with a 96 kHz signal. But, relating to the idea of downsampling, would maintaining 4X the required resolution benefit or alter the final sound quality upon playback (i.e., the actual analog waveform produced). I suppose though this statement implies that the 96 kHz container, when processed through the DAC, does not represent the original waveform as well as a 384 kHz container. I think this is where perhaps there is some point of contention between audiophiles as some argue that the resulting analog waveform produced after DAC is superior in the higher frequency container. Or perhaps does it depend on the container, PCM vs DSD for instance?
I love this. Very visual. May I suggest changing the y axis to not reference 0 db but purely db’s of dynamic range. Visually, the higher the box, the better. The non-technical may relate to it faster.
I like that idea…I’m working on it.
Since watching the interview you gave on Home Theater Geeks, you have more credibility than most off the people I’ve seen on any podcast, printed media, or anything else I’ve seen or read in a long time. While I’m nobody, I know firsthand about loss of fidelity when copying and editing analog material. The digital age has, for the most part, removed “generational decay”. What we can’t hear can’t hurt us, but going a little bit beyond our capacity to hear won’t either. At 53 years old I’m fortunate that I can hear to almost 17K. I can still feel the lows (I NEVER could hear too!). Dynamic range is the mot important thing in recording right now. In years past that was a given, whereas now it’s more about loudness. It disturbs me that kids with $300 crappy, but stylish cans, listening to mp3 files are driving the recording industry big boys. Please don’t get the illusion I’m bitter though! Thank you guys for fighting the good fight for fidelity.
Hi Mark, you correctly anticipated some ‘push back’ on the limit of human hearing.
You do realise that audiologists will generally say the limit is 18 kHz? And that the 20 kHz figure was adopted as a standard by audio engineers because it allows sufficient margin, beyond human hearing?
Even Oohashi, who published the papers on what he called a hypersonic effect, (which every independent re-test does not show up or validate), even Oohashi refers to the audible range as remaining under 20 kHz, and not in any way challenged by his work.
It is not even under debate or dispute. Except by a most peculiar fellowship that includes pretty much anyone looking for an excuse to explain their dislike of compact discs: LP lovers, analog recording fetishists, and in recent years, high-resolution digital audio proponents. All these naturally-repelling bedfellows will spring apart like a broken watch when discussion turns to any other topic, but, because it suits their needs of the moment, all will embrace this wrong idea in a most unedifying manner.
It is up to you if you want to continue the charade, especially since it curries favour with potential customers, but, because I so enjoy every other aspect of your *rational* and progressive agenda in pursuit of outstanding music recordings and reproduction, I implore you to prick this pimple on your blog’s nose and return your diagrams and comments to either 18 or 20 kHz.
128 kbit/s mp3 is 16 bits so where does this reduced dynamic range come from? Frequency response, sure, but dynamic range?
Also the 44,1 kHz 16 bit PCM dynamic range (96 dB) is not correct for dithered signal (effectively 100% of music) – the “potential fidelity” is actually higher, not that it matters in any reasonable way.
And considering the statement that there’s absolutely no reason to use 384 kHz sampling rate – there’s also absolutely no reason to suggest that there is need for >125 dB dynamic range (or that those numbers are really achievable with real microphones in real environments). Even 90 dB dynamic range in a real listening environment is equivalent to pain and ear damage and not needed for any real music. But of course, you know all of this, i’m absolutely certain. I’m concerned about the usual trolls who happily jump to conclusions that human hearing has more than 140 dB dynamic range – so everything digital is not good enough – enter vinyl. And so on and so on. Reasonable use of high res formats in recording – perfect. Suggesting that we need more than 16/44 for end product – unfortunately not supported by empirical data that has anything to do with real music not carefully selected test signals. Also suggesting tha’t human hearing reaches 40 kHz, reservations or not, is a real stretch.
Good points. I’m find tuning the graphic and format boxes. This is a potential chart not a practical chart because we need to be able to compare apples and apples. I do believe that it’s important for our recording and delivery format to exceed the range of human hearing. And I have not yet thrown in the towel on the humans being affect by ultrasonics.
This is all getting too weird. Linn says (from Chris’s link) that “The filter shapes used in the Linn DS up-sampler (384kHz) are the result of extensive listening tests”. OK, Linn is a great Company and has produced many excellent audio products, but many of us agree with Mark that “You don’t get any additional fidelity by upsampling.”
Then at the opposite side of the spectrum, Mark gets criticized by TAS (AXPONA fallout) because they believe that LP’s and analog tape are considered high resolution audio and quote: AIX’s Mark Waldrep proceeded to turn a near-half-million-dollar German Physik loudspeaker system, the $475k Emperor II, into a laughing stock with one of his high-res multichannel tapes. The sound on female voice was incredibly big, ill focused, bright, and unpleasant.”
So when the technology of blu-ray comes along and we can finally have recordings and playback hardware that is rated at 96KHz/24 bit which most audiophiles welcomed, all Hell breaks loose and High resolution audio turns into a wildfire of confusion. Add to that the Pono and supposedly downloads that are called Hi-rez, but are not, one wonders if there is any hope for the success of HRA.
I suggest the reading of Linn’s CEO when confronted with a very fair (and non-confrontational) ABX test. He simply couldn`t tell what he claimed was substantial change: the difference between several hi-def files. When things are really well recorded and in the realms of our hearing capabilities… that’s it! there’s no more.
As many people do -I do it myself. recording in 96/24 for a 44.1/16 release is VERY good. We have a lot of freedom with music that’s been captured as it should be. There’s a lot of room to play with it and try some extreme EQ’s or compressors you simply couldn’t even think about with a 48/24 file.
I suggest to all of Mark’s readers try the German recordings of Chris Jones. Throw it at anything you have… even the German Physics speakers Mark used at AXPONA and tell me if you can go (as a musician, mixing engineer, producer, master facilty) much further in fidelity. I’m talking about folk-rock-country music!!!!
The graphics shown today are the real thing and maybe the only missing point (Mark… you HAVE to give us that) is the world in which analogue tape (1/2″ 30fps) and vinyl reside.
I am reworking the chart…stay tuned.
Where did the bits go?
A standard CD has an effective bit rate of 1.411 Mbits/second (44KHz * 16 bits * 2 channels). In DSD, if I am correct, then each channel of the audio signal is sampled 2.8224 MHz. Therefore, 5.6 Mbits are sampled per second in a stereo signal. I would have expected either far more dynamic range or far more bandwidth. What happened to those bits?
Also, I noticed that you have human hearing going out to 40KHz. Why is that?
Because human hearing maxes out just below 20kHz, and to reproduce up to 20kHz you need a format that is at least 40kHz. See Nyquist rate on Wikipedia.
No Kevin, the charts are all pulled back to half their sampling rate, so the human hearing box should be drawn to 20 kHz.
I understand Nyquist, but if that is the explanation, then it is inconsistent with the other boxes on the graph which show bandwidth on the x-axis not sample rate. Mark?
In short, Blaine, those bits were drowned in shifted noise. When the DSD process shifts noise out of the audible spectrum, it builds up in the ultrasonic range, and soon it swamps any signal in those frequencies, and that signal data is effectively lost.
Wow, Grant. I didn’t realize the cost of that noise shaping. Very significant. Thanks!
That’s been one of my primary complaints about DSD from the outset…it delivers essentially CD quality AND there are no tools that engineers can use to work with it.
Yeah, I get it. Still in your terrific interview with John Siau, he believes that DSD can get to 120 db with a well designed low pass filter. I’d put that in the chart because it still isn’t as good as 24 bit PCM. Why get bogged down in an argument about filter implementation that shifts the focus from an obvious short coming of DSD?
I’m reworking the chart…stay tuned.
Hi Mark,
I would really love to see that reworked chart!
I’ll try to get to it…sorry.