Charting High-Resolution Audio
One of the major challenges for a website or an online forum is to generate traffic. The all-important metric is Google Analytics, which provides all sorts of information about visitors. The higher the number of visitors and the longer they stay on your site, the more you can charge for your advertising space. That’s if you charge for banner ads and other advertising. Thus far, I haven’t tried to monetize this site. That’s not to say that I won’t at some point in the future but I started it to provide accurate information about high-resolution audio and to counter stuff that people say that’s hyperbole or just plain wrong.
In order to increase the number of visitors to your website, you need to publish articles or post comments that are controversial or otherwise compelling. These days there are a lot of pieces being written about whether “high-resolution” audio is irrelevant. There’s no better way to stir the pot than to attack a trending piece of technology. So I read a piece at AVS Forum by my friend Scott Wilkinson (I actually had a hand in that one.) and yesterday the folks at Home Theater Review posted a piece asking the same question.
Both pieces are well written and play pretty straight with the facts but there were problems with the graphics. If you watched me on Scott’s Home Theater Geek show (#204), you’ll know that I gave him some flack for getting the 16 vs. 24-bits graph wrong. It’s showed up in his AVS Forum…without being updated. So I took it upon myself to recreate it with the right information.
The original version is presented below in Figure 1:
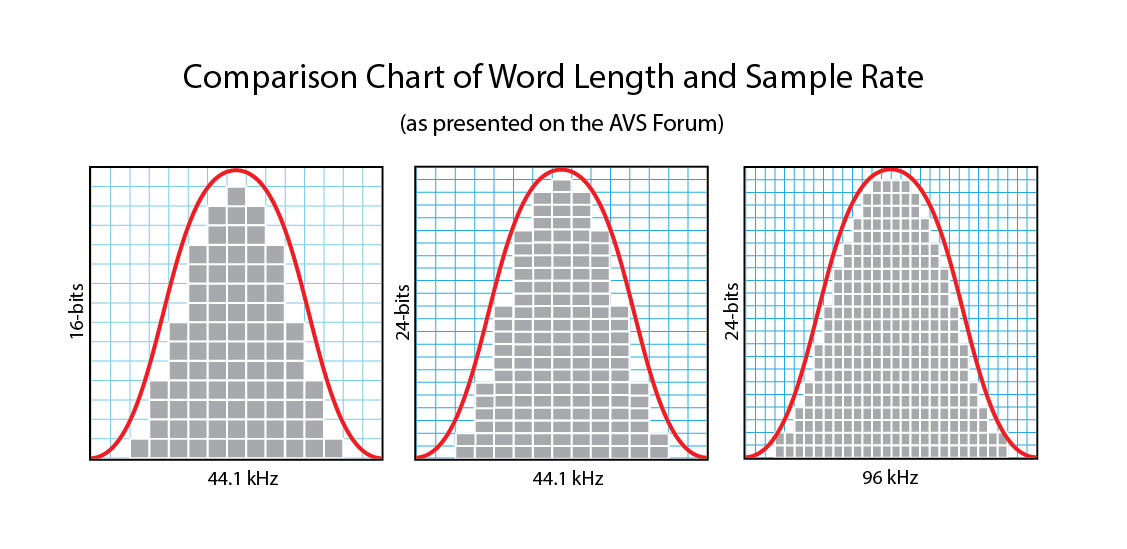
Figure 1: The original AVS Forum Comparison Chart for word lengths and sample rate. [Click to enlarge]
As I pointed out to Scott, the chart is incorrect because the same red amplitude is being sampled at each of the three different combinations. It would seem to imply that you get great resolution with the 24-bits against the same waveform. The fact is you don’t. You get the ability to sample a wider range of amplitudes…each bit provides roughly 6 dB of additional dynamic range.
Here’s the way the charts should look:
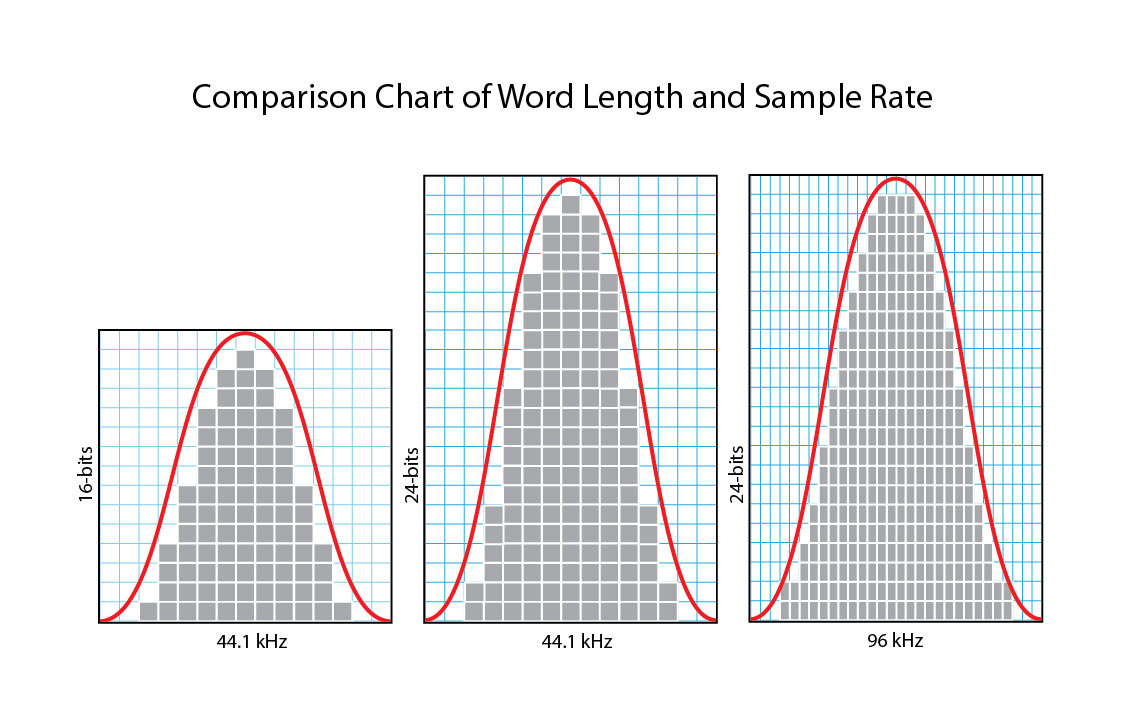
Figure 2: The reworked AVS Forum Comparison Chart showing the additional range provided by the 24-bits and the additional accuracy provided by the additional samples. [Click to enlarge]
Then there’s the piece at Home Theater Review. I noticed their graphic on FB and immediately flinched. Here we go again, I thought. Whoever made the comparison chart of “resolution levels” doesn’t have a solid grasp on the realities of frequency response and definitely doesn’t know anything about PCM vs. DSD.
So here’s the original chart as presented on Home Theater Review:
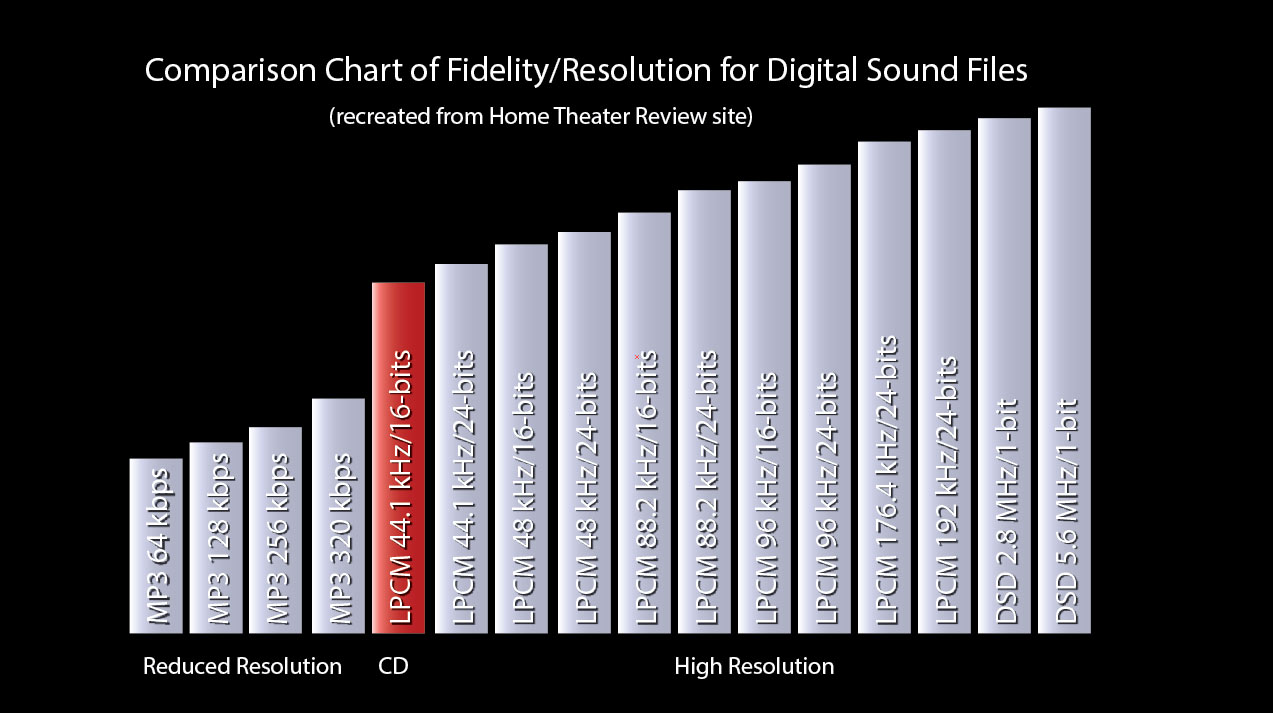
Figure 3: This is the chart from HTR showing the “relative” fidelity merits of different specifications and formats. [Click to enlarge]
I know Sony is saying that “anything greater than CD” specifications should be considered “high-resolution”, but does anyone really think that moving from 44.1 kHz to 48 kHz is going to be audible? Or that a DSD “1-bit” recording at 2.8224 MHz (probably sourced from an analog tape?) is going to provide more dynamic range and frequency response than a 192 kHz/24-bit PCM file (or for that matter any great fidelity than a standard CD)?
So why are the DSD formats on the rightmost edge of the chart and why are the bars the longest?
Here’s a reworked version of the chart that shows things more accurately positioned. I know some DSD advocates will want to challenge my ranking but if you look at the spectra of a well done CD and a typical DSD file…they are about the same. I’m not saying the sound is the same, but the “fidelity box” that can encompass the frequency response and the dynamic range is about the same. High-resolution PCM encoding provides the potential for much greater dynamics and frequency response.
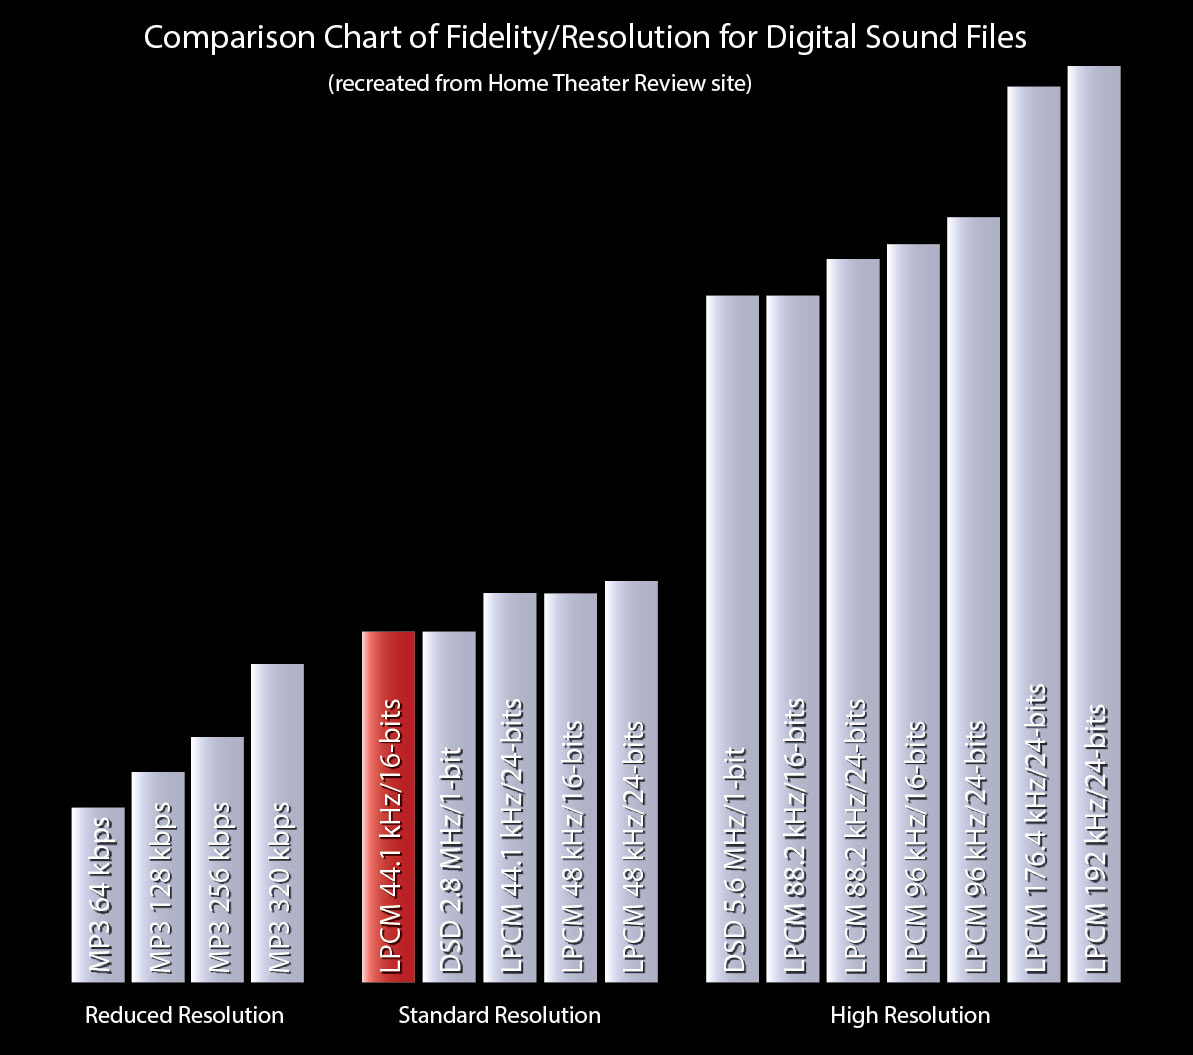
Figure 4: The HTR chart reworked to show the three relative levels of resolution…and the proper placement of the DSD format. [Click to enlarge]
These aren’t the worst charts I’ve ever seen (that distinction goes to the SuperHiRez.com placement of DSD), but they did miss the mark. We need to be able to use graphics in a way that communicates real information. I know it’s hard to avoid spin and biases but consumers need to know.
I’ll present a chart soon with the “fidelity box” approach soon.
It looks like from your chart that there is only a little bump in performance from MP3 320 kbps to CD sound quality 16 bit/44.1 kHz ……..? Is that what your saying ? That doesn’t seem right.
The reality is a 320 kbps MP3 can come pretty close to a CD. The ability of average listeners to tell them apart is about random.
Mark
I have to say I completely disagree with you on chart 1. I think AVS forum got it right. If you are sampling the same waveform the height of the analog red curve stays the same no matter how many bits your ADC has. Also, assuming zero is zero for all systems and you have the same upper limit (I don’t know what the loudest sound you are recording is, but let’s say it’s 120 dB). So the more bits your ADC has and given the same amplitude range from min to max then the ADC with more bits will have smaller step increments.
Why would you need/want to sample a wider range range of amplitudes? Like I said, zero is zero and we have no interest in recording jet engines at close range.
The reworked chart shows that more bits equals more dynamic range…it’s 1-bit to 6 dB roughly. In the AVS Forum version they squeezed more bits into the same amplitude implying more resolution within the same amplitude. This is not the case in PCM sampling. With the same amplitude, you get more vertical area, not more resolution in the same area.
You want to be able to handle all of the range of amplitudes without compressing them to fit in a dynamically limited format. With 24-bits we can eclipse the 96 dB available in a 16-bit CD.
Hi, Mark
As of DSD “possible” definition, you’re right. But, as you stated rightly… if the source for that DSD file is analogue tape… well, DSD becomes redundant. What really matters for consumers is to understand that DSD could be a good thing if there were studios recording on the system. Something that is not happening (please, DSD fans, don’t tell us that having a couple of studios in the world with 10 super-specialty records of absolutely unknown artists is having studios working DSD). So, I’d leave that standard out. It’s old and not embraced by the industry. Instead. 96 and 192 are the standard for recording studios,
I don’t know if it was after or before your interview with Scott that he had Allen Sides of OceanWay talking about hi-def. We simply can’t argue with the Studios that gave us records that rank amongst the best things ever recorded. And he keeps it that way using analogue and digital systems (I guess he’ll never give up using his SSL’s… I wouldn’t either!). They always end up with a commercial release that is 44.1/16 and that’s good enough for them and for 99.99% of us. The point here is when will the real consumers, -the masses, have access to hi-def? It’s been a long time coming!.
Last picture, which is corrected bar graph for resolution, is very interesting.
I noticed you put CD PCM and 2.8MHz DSD as same resolution. Is there any calculation for it?
I am very interested how 2.8MHZ DSD (which is same as one used for SACD as far as I know) is ended up same quality as normal CD.
Read today’s follow up charting. The fidelity specifications of a standard PCM CD is roughly the same as a DSD 64 recording.
Dr. AIX,
I recently had the good fortune of hearing a really good college choir (37 voices) perform in a superb acoustic, for them. It was a smallish church (seating 250) that featured an echo chamber right behind the choir. At any sharply terminated loud output there was a clear 2 seconds of rapidly decaying reverb in the mid to upper frequency range. I describe the echo this way because I could not detect that it supported significant low frequencies. Most of that is beside the point, however, because what I wish to touch on is that the choir had particularly pure voicing and pitch control, such that on occasion when soprano voices hit adjacent notes on the scale, such as F and F#, one could clearly hear the beating between the two notes.
This brings up a point for recording and reproducing frequencies that are clearly beyond measurable human hearing. When very close high frequencies well beyond human hearing cause low frequency beating of the type I described above, might not this beating be low enough in frequency to be clearly audible to humans? Can you shed some insight on the occurrence of this phenomenon?
Thanks,
alan
Read this article
http://people.xiph.org/~xiphmont/demo/neil-young.html
Rômulo
I’ve read it and discussed how many of the points that Monty makes are incorrect. He makes a good case but many of his conclusions are flawed.
Where in your chart would fall Dolby Digital 16/48 and DTS 16/48 and 24/96?
I’ll add them…the 96/24 is there.
Are you saying that DTS 24/96 is lossless?
The standard DTS algorithm doesn’t include the specifications of 24/96 or anything else any more than the Dolby Digital encoding spec does. It does give you roughly equivalent specs to 20 bits and 48 kHz. The only lossless DTS scheme is the DTS HD Master Audio format used on Blu-ray discs.
Then the DTS 24/96 that is used on DVD-Video discs, such as the Genesis box sets from 2007, is lossy, but how does it compare to the lossless formats, such as CD? In general, how does most DVD-Video sound (AC3 and DTS) fit into your chart?
There is no DTS 24/96 for DVD-Video discs. The encodes are without those specs…the only number is the 1500 kbps encoded stream. Regular DTS can sound better than CDs. The AC3 is slightly better than CD and DTS is better than that using the best parameters.