Pushing Back
How do we measure fidelity? Of course, we all like to think we know it when we hear it, right? And some of us…my self included…like to validate our ears with some science. I like to grab files and do the spectral analysis, check the file for clipping and observe the “characteristics” of the graphs (way too many files seem to exhibit things that are acoustically impossible).
I’ve routinely focused on frequency response and dynamic range as the two most important aspects to sound. Using Pulse Code Modulation, sample rate and word length establish the ability of a recording/reproduction system to capture and recreate the frequencies and amplitudes associated with a selection of music. But is there more?
Yes. There is phase, which results from timing variations as components of a sound (or an aggregate sound) reflect off walls and surfaces prior to reaching your ears or a microphone. Phase is a critical aspect of sound and does “color” or affect our perception of a sound source but it is not in the same league as the previous parameters. That’s why some speakers have “time aligned” drivers and why you can inform your A/V Receiver about how far the speakers in your 5.1 surround system are from the center location.
So how about “depth recreation, dimensionality, inner detail, and lack of electronic grain”, which I quote from an article over at Audiophile Review? Steven Stone’s article on “What’s Good Enough” tries to convince “good enoughers” that there are other elements to fidelity that “are all difficult, if not impossible, to quantify”. This in defense of the merits of high-resolution audio.
The gist of the piece is to open up a list of audiophile traits that exist outside of normal acoustics…the science of sound. As a believer in the benefits of high-resolution audio, I should be right there with him…but I’m not. Not for the reasons that he and plenty of others espouse.
He states, “The most important aspect of higher definition music (above 44.1/16) is its increased inner detail and low-level definition compared to the same material at 44.1/16”. I was asked about this notion of “increased inner detail and low-level definition” by a reader earlier this week. My response was that it’s audiophile self-delusion or inaccurate use of terminology. I’m especially dubious when the graphic that Steven used to accompany the statement is flawed (not that I haven’t similar illustrations myself to demonstrate the notion of word lengths and their effect on dynamics. Thanks to John Siau of Benchmark for setting me straight).
Here’s the diagram showing the effects of “low and high bit depth” on fidelity from Audiophile Review:
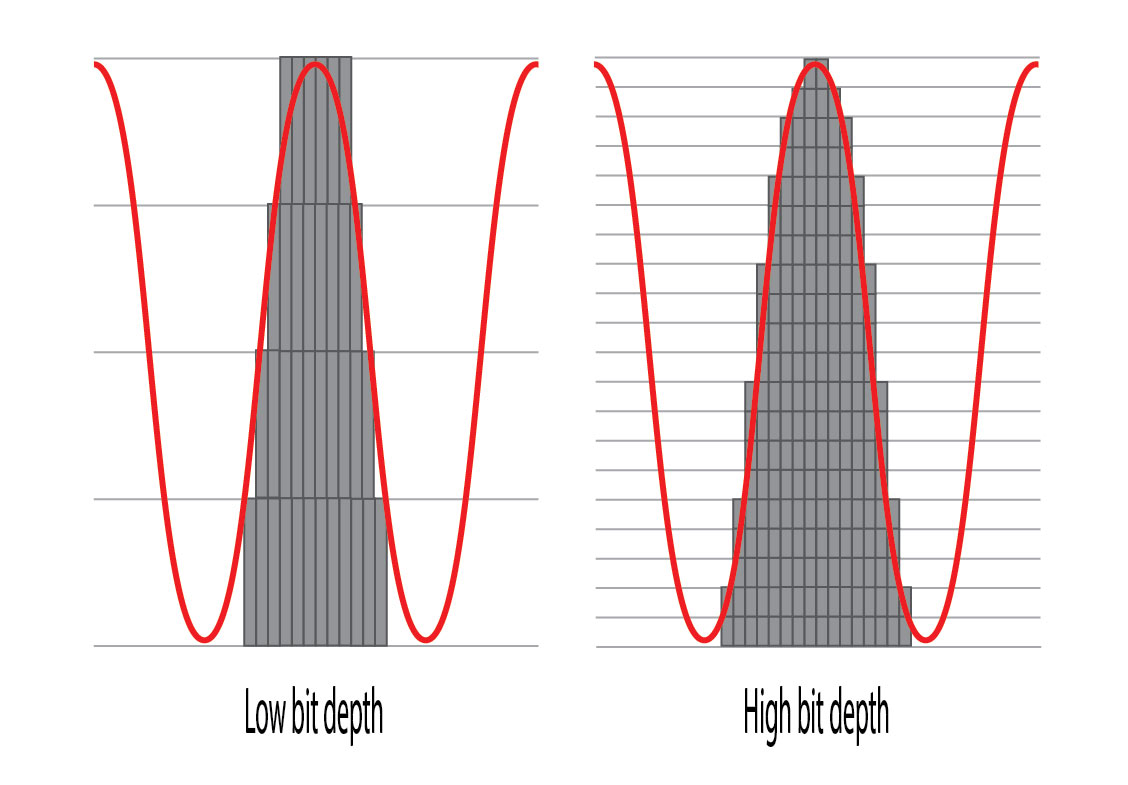
Figure 1 – A common way to represent sampling using “stairstep” graphics to represent each sample. [Click to enlarge]
Here’s the graphic remade showing the momentary values of the samples. These samples are NOT steps but rather points along a curve that is rebuilt during the digital to analog conversion process. If the job is done well, there are no discrete values or “stairsteps” in the output.
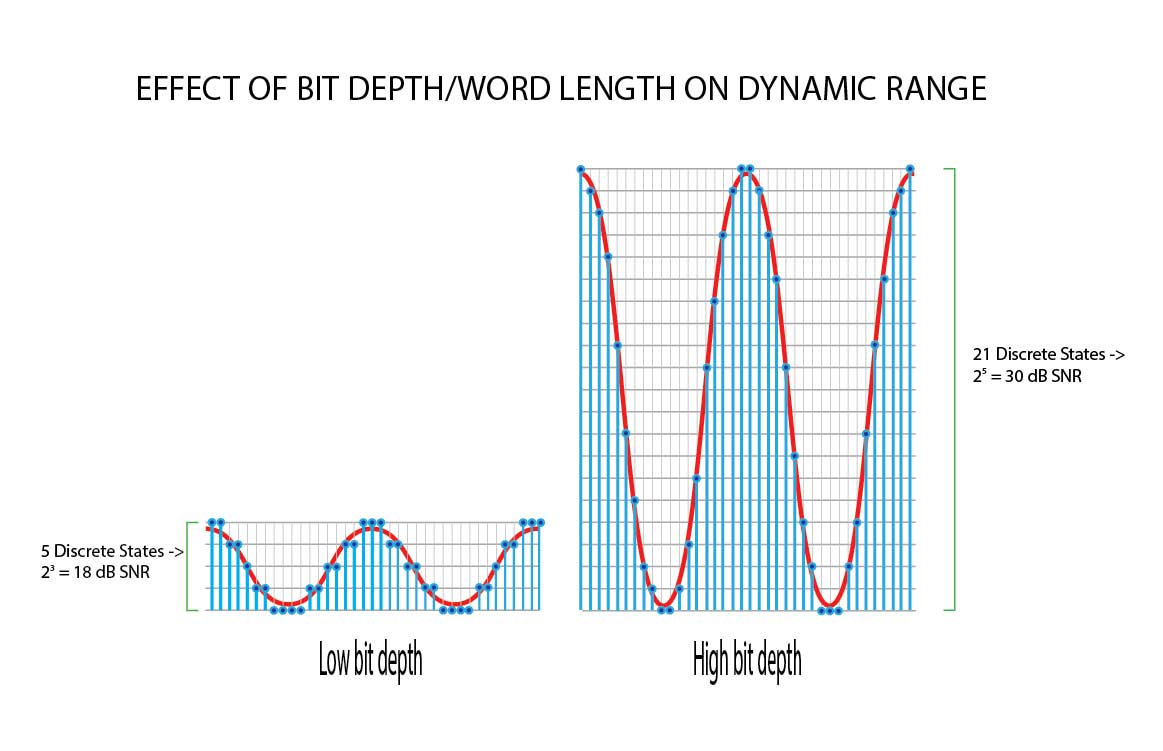
Figure 2 – Another and more accurate representation of sampling using low and high bit depths (shorter and longer word lengths). [Click to enlarge]
We get what we get from the sampling systems (either DSD or PCM). They capture sound and music and recreate it using converters that have specifications for sample rate and word length. The resultant audio doesn’t contain attributes like, “depth recreation, dimensionality, inner detail, and lack of electronic grain”. There is good fidelity to the original or not. Of course, there are lots of approaches to recording involving microphone placement, choice of mikes etc. These do influence the quality of sound but no engineer I know says, ” If I place a microphone here or use this piece of equipment, I’m going to reduce electronic graininess”.
I admit it’s tough to write about the qualities of a wonderful recording. I try to avoid making statements like those but I do understand we have to go there sometimes. But these are expressions that try to relate an emotional or other intangible feeling…they are not acoustic qualities. And yes, they are not measureable because they aren’t science.
Stick with acoustic realities and you’ll be far better off.
Hey Guys,
This week I alerted Mark to this article in Home Theatre Review and Audiophile Review. Of course, I assume he would have found it eventually by himself or with the help of others who like to follow his Real HD-Audio daily blogs. But within hours of publication I alerted him to it. I told him that I thought there was a lot to “chew on” on the article because I was excited about how he might develop his response to a topic that I think is at the cutting edge of developments in today’s realm of high resolution audio. He emailed me right back and thanked me for my swift response to the article.
Here is the beginning of his “chow-down” on the article. By the way, I have high regard for Steven Stone. He is a great videographer and audio aficionado, but Mark takes on some of the audiophile “hype” language that appears in Steven’s article.
There is no doubt in my mind that Mark likes to use science to describe his work, but he also allows for and honors the emotional responses that we all have to what we are listening too. What, I think, Mark objects to is the pseudo “golden ear” and “snake oil” kind of talk that attempts to approach the emotional side of discussions about audio with language that is “mystic” and unscientific.
Mark, seems to me, to be saying that we need to be careful not to muddy the science of audio with the naturally human and emotional responses that we all have in our listening habits. I think he is saying that we need to recognize when we have crossed the line from science and moved into the realm of expressing our feelings as we talk about audio. The language we use to describe our feelings about acoustic experiences is individually valid, but not necessarily scientific. And it is fun to explore the subjective responses of our audio experiences with other persons. But scientific audio-talk, on the other hand, needs to be verifiable. Precision in the use of language is paramount in the science of audio. Emotional response to audio requires a separate kind of talk, which is valid, but should not be used to obscure pure science. Both kinds of talk are valued, but each should be recognized for their contributions to audio knowledge and their limits. Often we talk about both facts and feelings at the same time in a confused jumble and good communication is hindered. Personally speaking, I would like to see more precision and definition in the science of audio. Right now there is lots of opinion floating about in the audio world. I would love to see the hobby that I enjoy so much move more into agreement based on science. It will only come about with much hard work by the whole audio community.
Dad.
I also regard Steven very highly…he’s an engineer as well as a skilled writer. I think you got the point and thanks for the heads up on this one.
I think that the high-end after-market business is desparately looking for some new source of digital-based revenue, a.k.a. snake oil, and is frustrated that science can debunk the wilder claims more effectively with digital than with analogue – as you just did in your posting.
As Count Dracula abhors the daylight, so these guys hate scientific reasoning.
Wow! Maybe that’s all about the topic. Thanks Mark and Jack for your words. In the world of music a few of us are in the business -I mean, just a small bunch. The rest are the consumers. That’s milions upon millions of people all over the world.
The point, as we’ve been discussing for a long time is:
a. can we define in words what HD audio is? and
b. can we convince the world that we’re right and they should listen to HD music?
Scientifically, Mark and and many others, including myself, can make our point. Acoustically and emotionally, it’s a different business. I was completely lost in a world emotions today listening to After The Gold Rush and Harvest (both, Neil Young’s albums). Was it melancholy? Was it audio precision? Was it gut feeling? I don’t know.
I once performed with my band “Words”, a track Neil recorded live for the Harvest album. When my band and myself listen to his original rendition of the song we’re transfixed. It’s a ver badly recorded track (I guess it was a two-track running real-time), but the emotions and power of the whole thing, makes it memorable.
So, yes… we’re in a very difficult position. Mark has stated many times that the claims of many people (including Neil’s) is absurd. And I agree. If you re-master a track coming from a magnetic tape you’ll never, ever, come close to HD audio… the original is the brickwall. Even a track recorded digitally directly to PT in 96/24, if it’s not done with care, precision and LOVE, it can be worse that any good Red Book CD, and it would be in the realm of HD audio.
My LD-10LR ESS speakers with the whole shebang of system to drive it is just ONE window in the world of audio. That’s my setup at home. But how can I compare that to my studio? No way. The hardware is in a very different world of budget, room acoustics and purpose.
And here’s the big problem. There are millions of possible audio setups that actually populate cars, homes and heads. How can we -who want people to listen to the whole enchilada, drive them to that audio nirvana we experience every day without the burden of making them understand all of our scientific approach?
I love the emotion, sentiments and feeling that Neil can deliver. I’m a huge fan of John Gorka for the same reason. When he sings “Italian Girls” or “I Saw A Stranger With Your Hair”, you know it’s from personal memory. My recording of Jennifer Warnes singing “So Sad” or “Prairie Melancholy” gets to me every time. With high-resolution and great recording technique, the artist is singing to you, the listener.
I’ll be the first to admit that I’m at the edge of my understanding. That said, isn’t there also an accuracy, or perhaps precision, component to bit depth as well?
Mike…bit depth, or more accurately, word length provides the discrete amplitude levels that a sample can identified with. The fact that they are discrete means that every sample is an approximation…this is called quantization error and results in noise. We use dither to mask the noise, which reduces the full potential of dynamic range by about 3 dB out of 120+ dB. There isn’t any precision or accuracy component. You take a sample, pick the closest amplitude value and store it.
Hi Mark, it seems logical, but due to the wonderfulness of dither, it isn’t so. Essentially, dither forces the quantised digital value to jump between adjacent step values at random. Being random instead of an error in signal value, it has converted what was an error in precision into pure noise, i.e. not signal-related. Basically the ‘staircase’ transfer curve is no longer a staircase but a perfectly straight line, but thicker due to the random hairy noise, with a thickness of one ‘step’. The key point being that it is perfectly straight.
Hence the completely true saying that the analog output of an ADA conversion is *exactly* like the input, with no steps or imprecision or linear distortion, except with a trace of noise added and all frequencies stripped above half the sampling frequency.
Digital is THAT good! People just don’t want to accept it.
Hope this was helpful.
Thanks…I’m thinking it would be a great modification to my “ideal” graphic to the “realworld” post dither version showing the addition of the noise.
Apologies, my comments were directed to Mike, not Mark.
I think the second figure is also misleading for the following reasons:
1. On the left you use 5 discrete values. This fits into 3 bits. Given 6 db dynamic range per bit it should be annotated by 18 db and not 24 db. On the left you use 21 discrete values. This fits into 5 bits and would result in a dynamic range of 30 db and not 120 db. The graphic confuses the number of possible values with the number of bits necessary to distinguish the values.
2. The graphic shows a small amplitude on the left and a high amplitute on the right. I assume that a sine curve is shown. However, the resulting tone has no dynamic range. A single tone’s dynamic range has a width of 0. You have to show two tones for each bit depth to show dynamic range.
3. The amplitude on its own has no meaning. I would assume most recordings use the highest bit value for the loudest part. The amplitude of the tone during playback is mostly determined by the volume setting of my amplifier.
4. A better way to show the higher dynamic range of more bits is to show the difference between the signal and the quantization noise. This is nicely shown in the bit-depth (http://wiki.xiph.org/Videos/Digital_Show_and_Tell#Bit-depth) section of this video: http://xiph.org/video/vid2.shtml (starting at 8:45, especially around 9:53)
Christoph…you’re absolutely right. Thanks for the note…I’ve corrected the mistake. I did just as you say and counted the levels (actually miscounted) and simply multiplied by 6. I should remake this thing to use powers of 2 rather than 5 and 21 steps. It would be easier to grasp. I based it on the one from Audiophile Review and good stuck.
As to your point 2 & 3, the plots are not intended to show dynamic range, but rather the benefits of more bits. Engineers generally “nomalize” the highest peak to use the maximum range, thus the curve goes to the top.
Also, assuming maximum sampled frequency, you only need show one sample point at the maxima and the minima of your sine curve.
You’re right that I haven’t shown the Nyquist max frequency which does requires only two samples per cycle. However, the samples DO NOT need to coincide with the max and min or the sine curve. They can be anywhere.